Collision in Two Dimensions Lab
Annemarie Branks
Professor Wolf
Objective: In a two dimensional collision demonstration, determine if momentum and energy are conserved through out. Determine if momentum and energy are still conserved when one of the colliding masses change.
Procedure:

1. To determine the positions and time of two balls in an elastic collision, a camera must have a bird's eye view of the experiment. Below the camera is a glass table where the collisions will take place. For simplification, friction is neglected in this lab. Instructions for setting up the camera for LoggerPro are in the Lab Manual, but if there is a green screen, the resolution needs to be decreased.
2. For this lab, there will be two trials. The first requires two identical balls. Use one of the balls to make sure the glass table is leveled. Place one of the balls in the middle. After hitting collect, launch the other ball at the stationary one and let them hit. The stationary mass we are calling M2 which was 66.7 grams. The launching mass in this experiment is M1 which was 66.8 grams.
3. For the second trial, record a second video using M2 and another ball that we are going to call M0. M0 was an aluminum ball of mass 28.9 grams.
4. With the two recorded videos, several different calculated columns are going to be made so we can determine relationships. To get the numerical data we need, take the first video and set up and origin and axes on video. The x-axis should line up with the motion of the ball being launched, M1. Begin plotting points of M1 from the moment it is released. When the points are plotted for M1, plot the points for M2 starting from the moment before the two balls collide. From these points, LoggerPro should generate columns for the position and velocity of each ball in the y and x direction.

This is the position graph for both M1 and M2.
5. Repeat this process for M0 colliding into M2. Here are our results:

This is what graphing the points looked like for the collision of M0 into M2.

This is the position graph for both M0 and M2.
6. To further analyze the relationship of two masses' momentum and energy in each trial, create columns for momentum in the x and y directions for each ball, momentum in the x and y directions for both balls, the total momentum, and kinetic energy.

The calculated data columns for the trial with M1 and M2.

The calculated data columns for the trial with M0 and M2.
7. It is easier to see the relationships between momentum and energy for each trial if you look at the graphs they generate. The numbers we generated are very large because we never set a scale, but the numbers should still be able to give the right idea.


These graphs show that momentum is conserved in both trials.
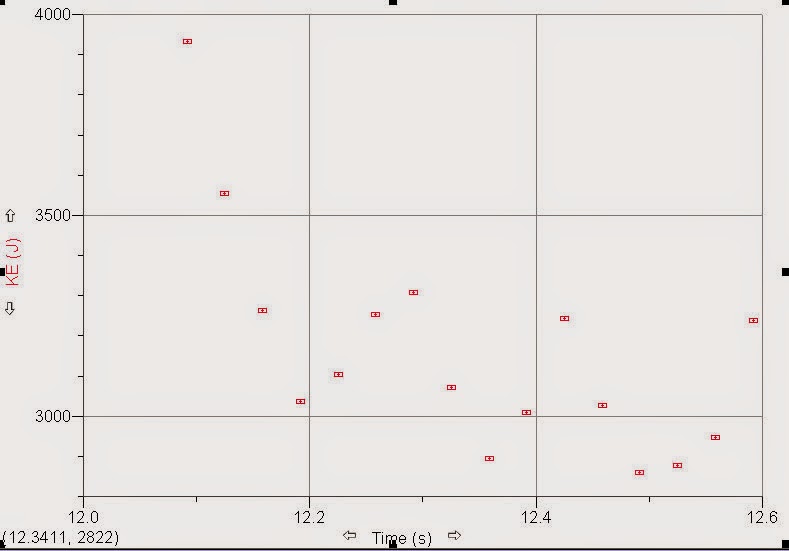

The Kinetic Energy graphs do not show a conservation in Energy. Energy is being lost due to friction between the ball and the glass table.
No comments:
Post a Comment