Sunday, June 7, 2015

Lab 20: Physical Pendulum

Physics Lab #20 started on 6/3/15
Physical Pendulums
Annemarie Branks
Professor Wolf

Objective: Determine the periods of two physical pendulums swinging at two different orientations each.

Procedure:
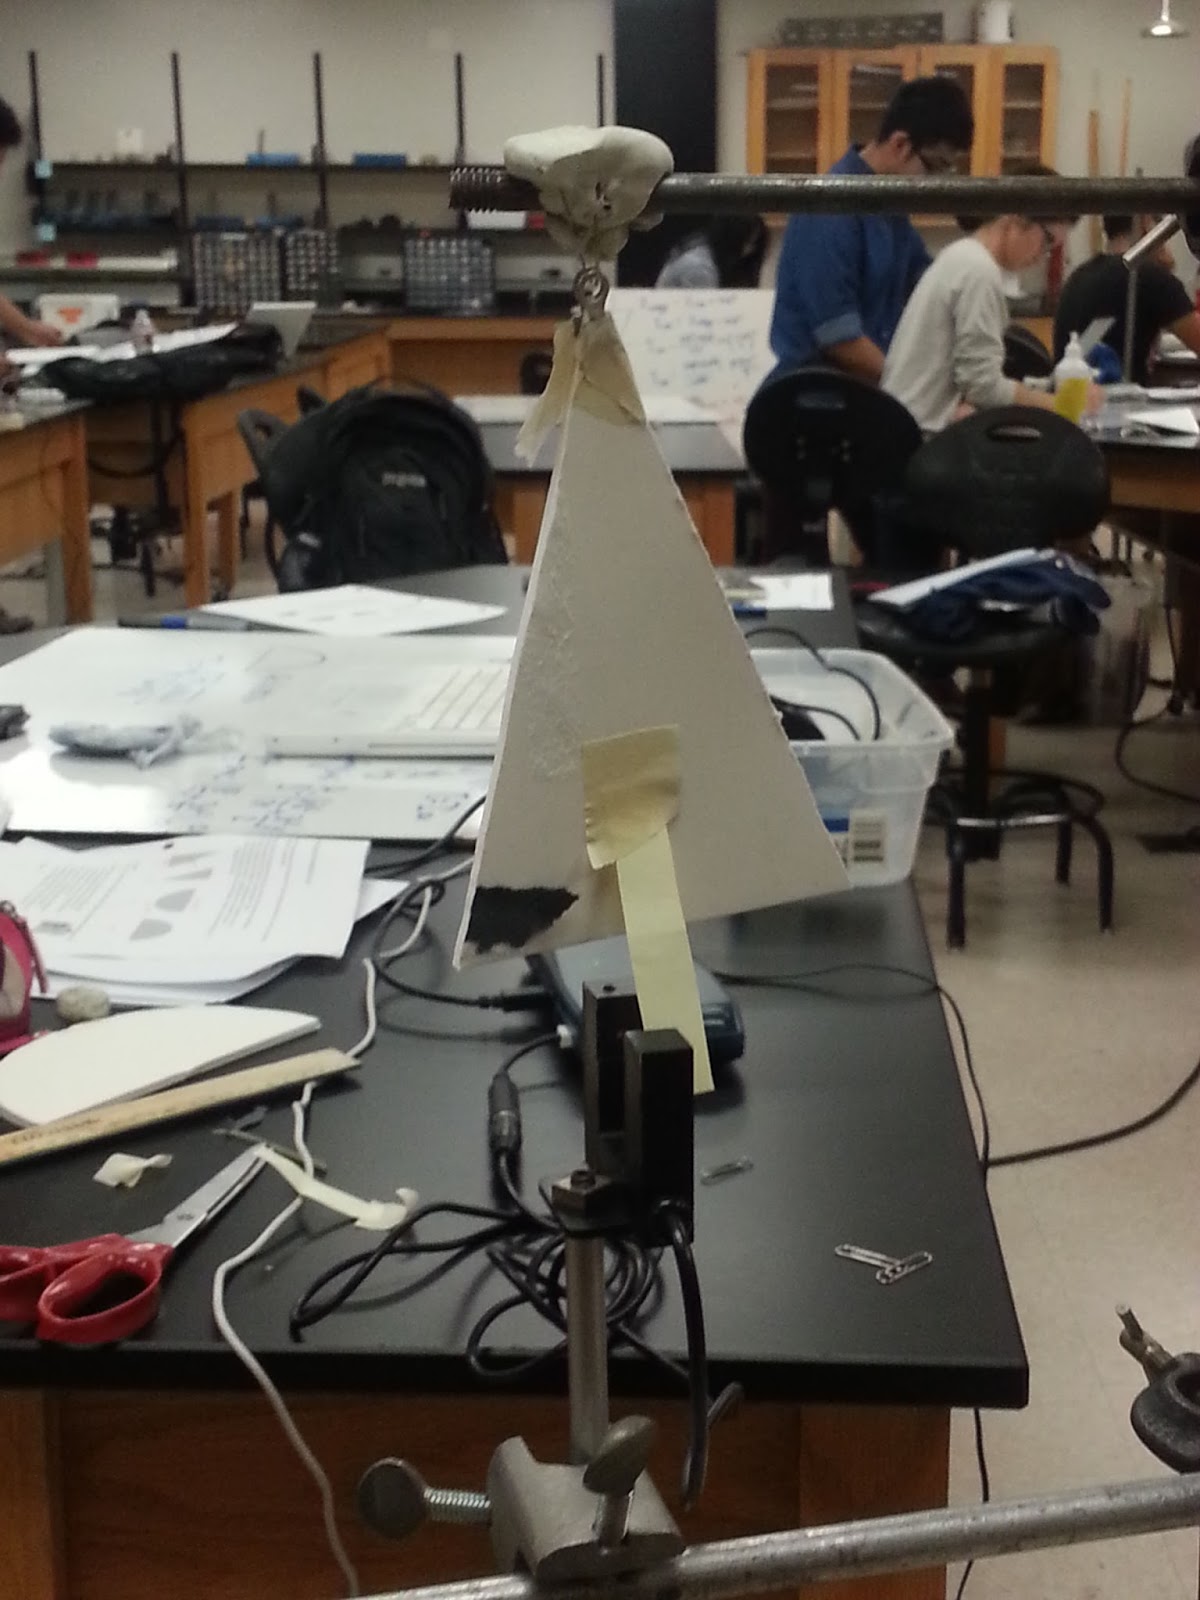
     1.  Cut out an isosceles triangle and a semicircle out of a stiff material. Measure their dimensions.
     2.  To determine their theoretical periods, T, first find their centers of mass. 
     3.  Determine the moments of inertia for each shape with the pivot at opposite ends. You will need to use the Parallel axis Theorem to do this.
     4.  Using Torque=Inertia*angular acceleration, find omega. Use omega to find the period for each shape at their different orientations.
     5.  Set up the experiment so that each shape can swing from two different points. To do this, tape small metal circles on each side and run a paper clip through it. Have the paper clip securely attached to a metal rod. We used clay to do this. Connect a photogate to logger pro and orient it so the shape will swing through it.

     6.  Run the experiment under the Pendulum Timer file and get their periods.
  • For the semicircle swinging from the flat edge the Period is 0.651110 seconds. Reminder that the calculated period was 0.662 seconds.
  • For the semicircle swinging from the point on the curve, the Period is 0.660176 seconds. Reminder that the calculated period was 0.649 seconds
  • For the triangle swinging from its tip, the Period is 0.699378 seconds. Reminder that the calculated period was 0.686 seconds
  • For the triangle swinging from its edge, the Period is 0.700107 seconds. reminder that the calculated period was 0.860 seconds.
The calculated and the actual periods are all relatively within the same ball park, except from the last trial which was more off than the others. These differences could be attributed to sources of error

Sources of Error/Uncertainty:

  • The photogate/LoggerPro gave varying periods for each swing and we used the last period it detected rather than the average
  • An uncertainty of +/- 0.1 cm when measuring the shapes
  • The shapes were not perfectly cut with precision.
  • The way the paperclip was bent changed the way the shape swung
  • The circles we taped onto the shapes could have slightly changed the center of mass
  • Its possible there was a slight draft in the room that caused the shapes to swing undesirably


Tuesday, June 2, 2015

Lab 19: Solid Ring Pendulum

Physics Lab #19 started on 6/1/15
Solid Ring Pendulum
Annemarie Branks
Professor Wolf

Objective: Determine the period of a pendulum ring.

Procedure:
     1.  Measure the inner and outer diameters of the ring with the vernier caliper. No need to weigh the ring because the masses will cancel out. For our little diameter, we measured 115.1 mm, and for the big diameter we measured 139.0 mm.
      2.  Notice the indent on the ring. The indent was made at the average of the two radii. This is where the ring will be swung on the rod. Using the moment of Inertia for a ring  about its center of mass, we can use the parallel axis theorem to find the moment of Inertia about the pivot. The moment of Inertia at the pivot was 0.00811 meters^2 * Mass of the ring. The calculations are shown below:
     3.  Using Torque=Inertia*angular acceleration, plug in your found Inertia and solve for angular acceleration. The constant in front of the sine theta is omega squared. Find your omega value. For us, it was 8.77 rad/s as seen in the above photo.
     4.  Now that omega has been found, the period can be found and ours turned out to be 0.717 seconds.
     5.  With the theoretical value found, set up the ring to swing at its indent on the rod. Place a photogate underneath it. A piece of paper or tape could be used if the ring does not pass through the photogate easily. With the photogate set up to LoggerPro, find the period. The period we go from LoggerPro was 0.719909 seconds which is pretty close to our theoretical value. We suspect there are sources of error since LoggerPro gave some variation of the period, but it always stayed around 0.72 seconds.

Monday, May 25, 2015

Lab 17: Uniform Triangle's Moment of Inertia about its CM

Physics Lab #17 started on 5/13/15
Finding the moment of inertia of a uniform triangle about its center of mass
Annemarie Branks
Professor Wolf

Objective: Find the moment of inertia for a uniform, right triangle plate about its center of mass for the two orientations as shown below.

Procedure:
     1.  Before setting up the Pasco rotational sensor kit, we want to find the theoretical moment of inertia for the triangle about its center of mass. Use the parallel axis theorem to find its moment of inertia about its center of mass.  The calculations below shows the moment of inertia for the parallel axis.
     2.  Considering that the center of mass for a triangle is a third of the way in from its edge (B/3, H/3), we can use the parallel axis theorem to find its moment of inertia about its center of mass. Below is that calculation. 
Measure the dimensions of the triangle and its mass. Ours was 14.85 cm by 9.80 cm, and 456 g. With this equation, it is found that the moment of inertia for the triangle when the longer side is H turns out to be 0.000243 kg*m^2. When the triangle has the shorter side as its H, the inertia is 0.000559 kg*m^2.
     3.  Now, we want to see if our calculations are close to the Inertia we get when we use the Pasco system to find the angular acceleration. To get the inertia of the triangle alone without the system, we need to find the angular acceleration of the system without the triangle at all. Be sure to include the holder. So this system includes the holder (26 g), a large pulley (36.3 g; diameter 5.36 cm), two steel disks (1360 g; diameter 12.630 cm) where only the top disk spins, and a hanging mass (24.6 g).
     4. Set the system to detect 200 marks per rotation and generate an angular velocity versus time graph. Find the slope of the hanging mass going up and the hanging mass going down. This is the graph we generated.
We will be using the same inertia equation from the angular acceleration lab to find the inertia. This is that equation.
"m" will be the hanging mass and "r" will be the radius of the pulley. 
     The inertia for this set up, without the triangle, came out to be 0.00293 kg*m^2.
     5.  Repeat this process, but include the triangle. We did this triangle with the long side pointing up. This is the graph we generated.
     The inertia for this set up, with the triangle, came out to be 0.00317 kg*m^2. So to get the inertia of the triangle alone, subtract the inertia of the system without the triangle from the inertia of the system with the triangle. This gives a value of 0.00024 kg*m^2 which is close to our theoretical value of 0.000243 kg*m^2.
     6.  Repeat this process again but change the orientation of the triangle. This time the short side of the triangle is point upwards. This is the graph generated.
     The inertia for this set up came out to be 0.00356 kg*m^2 which makes the inertia of the triangle alone with the short side pointing up, 0.000630 kg*m^2. This is not as close to its theoretical value of 0.000559 kg*m^2, as the last trial was.

Conclusion: The values we came up with from the experiment were close to the values we solved for using the parallel axis theorem. This experiment taught us how to use the parallel axis theorem and that it actually works. The slight differences in values could be due to some uncertainties/sources of error.

Sources of Error/Uncertainty:
  • There could be human error when measuring the diameter of the pulley and the dimensions in of the triangle
  • Scales are often faulty or inaccurate or can only measure up to a certain number of decimal places.
  • The triangles may have not had their bottoms completely parallel to the ground.
  • The Pasco system may not be as quick as we would like it to be when counting the markings on the side of the disks.


Friday, May 22, 2015

Lab 16: Moment of Inertia and Frictional Torque

Physics Lab #16 started on 5/11/15
Moment of Inertia and Frictional Torque
Annemarie Branks
Professor Wolf

Objective: Determine the moment of Inertia of the disks. If a falling mass is tied to the rotating disks, determine how long it would take for the mass to travel one meter at a certain angle.

Procedure:
     1.  Using a rotational apparatus like the one on the picture below, determine the apparatus's mass and dimensions. The apparatus had its total mass engraved on it, so we found the mass for each of the sections (using a volume to mass ratio) as well as their measurements using Vernier calipers. After doing so, we found the total Inertia of the system simply be adding the inertia of the individual sections. The accepted inertia for both a disk and a cylinder is 0.5MR^2.
Here are our measurements for this particular apparatus which gave us a net Inertia of 0.0209 kg*m^2.
     2.  Set up a camera an connect it to LoggerPro. Spin the apparatus and use video capture to mark its positional rotation. We added a piece of tape a drew a purple dot so we could better see and indicate where to make out marks. Form a theta (radians) versus time (seconds) graph. 
To generate the best of fit, we used a quadratic fit because of the equation θfinal = 0.5αx^2+ωx+θ
     3.  The A values, when averaged, will help give the angular acceleration of the system which in our case is -0.5644 rad/s^2. With this we can find frictional torque when considering the equation Torque=Inertia*angular acceleration. Our frictional torque is -0.01180 N*m..
     4.  The professor asked us to solve acceleration of the cart in a system like the one shown in the photo below where the ramp is at a 40 degree angle. 
     Using Newton's Second Law, first find the acceleration (which ended up being 0.0281 m/s^2) and then use kinematics to find the time it took to travel one meter. The calculations are shown below. The time it takes the cart to theoretically travel one meter at a 40 degree angle is 8.45 seconds.
     Now, simply replace the 40 degree angle for the actual angle and find the time it theoretically takes the cart to travel one meter. In our case the acceleration came out to be 0.0.409 m/s^2. This acceleration gave us a time of 6.99 seconds.
     5.  With the system set up at your actual angle, and the cart's string wrapped around the smaller cylinder, let go of the cart so that it will slide down 1 meter. Use a stopwatch to find the time it takes to travel that one meter and see if it matches up with your calculations.
     For our experiment, we conducted three trials.
Trial 1: 6.9 seconds
Trial 2: 6.8 seconds
Trial 3: 6.9 seconds
     These times are extremely close to the theoretical time, so we can say that we accurately found the system's moment of inertia and frictional torque.

Sources of Uncertainty/Error:
  • Though the times for the trials are "desirable", there is still uncertainty in the stopwatch and the reaction time of the person using the stopwatch.
  • There are uncertainties in the measurements and in the calipers being used
  • There are uncertainties in the LoggerPro program
  • There is a human uncertainty when plotting the points on LoggerPro. We plotted points at the tape mark which was not exactly at disk's edge.


Thursday, May 21, 2015

Lab 18: Conservation of Energy and Angular Momentum

Physics Lab #18 started on 5/20/15
Conservation of Energy and Angular Momentum
Annemarie Branks
Professor Wolf


Objective: In a rotational system that experiences an inelastic collision, determine the height at which the bottom of the system experiences for one complete swing. Predict what the height ought to be according to the Conservation of Energy and Conservation of Angular Momentum theorems. Confirm these principles by comparing the calculated final height to the actual final height.

Procedure:
     1.  Set up a rotating system like the one shown below. We used a meter stick of 147 grams pivoted at 10 cm from the top. A clay mass was placed on the ground in such a way that when the meter stick was let go from the horizontal position, the two would collide. To ensure an inelastic collision, we wrapped tape around the clay and one end of the meter stick with the sticky side of the tape exposed. 

     2.  We want to determine if the Conservation of Energy and Conservation of Angular Momentum theorems are good for calculating the final height. The first part of the system's swing is its gravitational potential energy. That gravitational potential energy will turn into Kinetic Energy just before the meter stick hits the clay. We want to use rotational kinetic energy  which is equal to 0.5*I*ω^2. So before we set up our energy problem, we want to determine the meter stick's moment of inertia. Use the Parallel Axis Theorem, which states that it is equal to the object's Inertia about its center of mass plus its mass times the distance it moved squared, or I = Icm +Md^2. The moment of inertia for a rod about its center of mass is 1/12*ML^2. The pivot moved 0.4 meters from the center so our new moment of inertia is 0.0358 kg*m^2. The calculations for that value are shown below.
     3.  Now that we have Inertia of the meter stick, we can do a Conservation of Energy problem to find the angular speed just before it hits the clay. If the origin is set at the very bottom part of the meter stick's swing, then in this case the height is 0.9 meters. This then converts into Kinetic Energy and Gravitational Potential Energy. The height for the GPE is the distance of the center of mass to the origin on the down swing, which in this case is 0.5 meters. Here are our calculations for finding ω which came out to 5.68 rad/s.

     4.  Using the initial ω in a Conservation of Angular Momentum problem, we can final final ω which comes from the meter stick colliding and sticking with the clay. Conservation of Angular Momentum tells us that Linitial = Lfinal which is the same as Iωinitial = Iωfinal. Below are the calculations for finding ωfinal which came out to be 3.47 rad/s.
     5.  The meter stick, along with the clay attached, will swing up to a certain height and to find that height we will need to use Conservation of Energy again. My lab partner and I had some difficulties with this part, but other people advised us that it would be easier to put zero GPE at the pivot. Below are the calculations to find h. 

     6.  So now that we have a calculated h of 0.384 meters, we can compare it to an actual value. With the system that has been set up, use a camera and video capture on LoggerPro. Start plotting data points from the frame where the meter sticks to the clay. Find the highest that the clay will reach when it momentarily has no kinetic energy.
The data set shows that the highest the clay at the end of the meter stick gets is 0.3651 meters. Our calculated height is larger than the actual height. The difference can be attributed to some sources of error and if we considered all these uncertainties, then we might be totally confident that the Conservation of Energy and Angular Momentum theorems work.

Sources of Error/Uncertainty:
  • There was inaccuracy due to human error for plotting the data points using video capture.
  • The camera had poor resolution and the swinging meter came out blurry making it difficult to the plot the points.
  • We did no consider exactly where on the meter stick the clay was sticking to so its distance from the pivot may be inaccurate.
  • The meter stick had a curve to it which affected the path of the moving meter stick. Depending on where it was curved in the stick this could have changed the actual center of mass for the meter stick thus changing its moment of Inertia. 


Tuesday, May 19, 2015

Lab 15: Angular Acceleration

Physics Lab #15 started on 5/4/15
Angular Acceleration
Annemarie Branks
Professor Wolf

Objective: Find the angular acceleration for differing disks with an applied torque and determine their moment of inertia.

Part 1:

Procedure: 
     1.  The professor provided us with kits from which we will need a steel disk marked with an orange "this side down" sticker, an unmarked steel disk, an aluminum disk, a small pulley, a large pulley, and a hanging mass. The pulleys will be used as disks rather than pulleys. Measure all of these objects' diameters and masses.
Top steel disk - diameter: 12.644 cm; mass: 1360 g
Bottom steel disk - diameter: 12.640 cm; mass: 1348 g
Top aluminum disk - diameter: 12.640 cm; mass: 466 g
Small pulley - diameter: 252 cm; mass: 10.0 g
Hanging mass - mass: 24.9 g
In the picture, next to the kit there is the Pasco rotational sensor which pumps air in an effort to make the rotating disks frictionless. 
     2.  Connecting the Pasco to LoggerPro and its tube to an air valve, you can start collecting data at 200 counts per rotation. 
     Using the different pulleys, disks, and hanging masses we generate  angular velocity versus time graphs. Using those graphs we can find the angular acceleration from the graph's slope. But as you can see from the graphs below, there are two slopes. One slope is for when the hanging mass is going down and the other is for when it is going up. Here are a few of the graphs we generated but they look similar for all six experiments.
Experiment 4 with hanging mass only, large pulley, and the top disk steel.
 Experiment 5 with hanging mass only, large pulley, and the top disk aluminum.
Experiment 6 with hanging mass only, large pulley, and top steel moving with the bottom steel.
The data for experiments 1-6.
     From this data we can see that if the hanging mass doubles so will the system's angular acceleration. When the hanging mass triples the system's angular acceleration triples. So, from the first three experiments we see that for however many times the hanging mass is increased, then the system's angular acceleration increases by that much.
     When we increase the mass of the spinning disk, the angular acceleration changes. We can see from the data that when the top disk's mass is decreased by nearly three times, the system's angular acceleration increases nearly three times. When we nearly double the masses by having both disks spin at the same time the angular acceleration is two times slower. We can conclude from the last three experiments that for however many times the rotating disks' masses increase the angular acceleration decreases by that many times.
     3.  For further analysis and understanding, set up a motion sensor below the hanging mass and generate a velocity (m/s) versus time graph. When a linear fit is done, the slope should give a tangential acceleration of the system. Unfortunately, I did not get a picture of the graph with its linear fit but it seems that the acceleration of the hanging mass is about -0.050 m/s^2. This was done using the set up from experiment #4. 
We can confirm if this tangential acceleration is accurate by using the equation a(tangential)=α*r.  Alpha was 2.220 radians/s^2 and the radius of the large pulley was 0.0251 meters. This gave a tangential acceleration of 0.0556 m/s^2 which is pretty close to my "rise over run" method for determining the acceleration from the velocity graph.

Part 2:

Procedure:
     1.  We want to determine the moment of Inertia for each of the disks, but we need to consider frictional Torque. When we do consider frictional torque the moment of inertia is I = (mgr/α)-mr^2
The calculated Inertias show that changing the mass of the spinning disk changes Inertia most dramatically. Even the hanging mass differences do not seem to give much affect to the amount of force needed to get a disk moving. 

Sources of Error:
  • There was uncertainty in the measurements of the disks' diameters due to human error and possibly error in the tool the disks were measured with
  • The scales gave uncertainty in the masses. Our hanging mass was "supposed" to be 25 grams, but when weighed it gave a 24.9 gram measurement. 
  • There is uncertainty when we assumed that the additional masses added to the hanging mass were each 25 grams.
  • There is uncertainty in the accuracy of LoggerPro.
  • The Pasco may have some degree of uncertainty when counting the marks on the disks
  • There could be uncertainty in the number of marks on a disk. We simply trusted our professor who said there was 200 marks.
  • The motion detector gives some uncertainty based on how accurate and quick it is.


Tuesday, May 5, 2015

Lab 14: Basic Pendulum Lab

Physics Lab #14 started on 4/27/15
Basic Pendulum Lab
Annemarie Branks
Professor Wolf

Objective: Determine the initial velocity of the ball shot into a pendulum.


Procedure:
     1.  Using a cleverly made apparatus, a spring launches a ball into the hanging mass of the pendulum. The ball and the mass form an inelastic collision. Momentum swings to the pendulum with the ball up a certain angle which is found when the apparatus pushes a vertical wire that is hanging next to the pendulum.
     2.  To find the initial speed, use the Conservation of Momentum Theorem and the Conservation of Energy Theorem. We were given the mass of the the white block of the pendulum, which is 80.9 grams +/- 0.1 gram, and the mass of the ball, which is 7.63 grams +/- 0.01 grams. After firing the ball, we were given and angle of 17.5° +/- 0.5°. We also found the length of the pendulum which is 20.2 cm +/- 0.1 cm.  
Here are the calculations to find the initial velocity at which the ball was launched into the pendulum block. The answer ended up being 4.97 m/s.